CI/CD: DevEx Survey Questions to Help Teams Diagnose Pipeline Friction

CI/CD: DevEx Survey Questions to Help Teams Diagnose Pipeline Friction

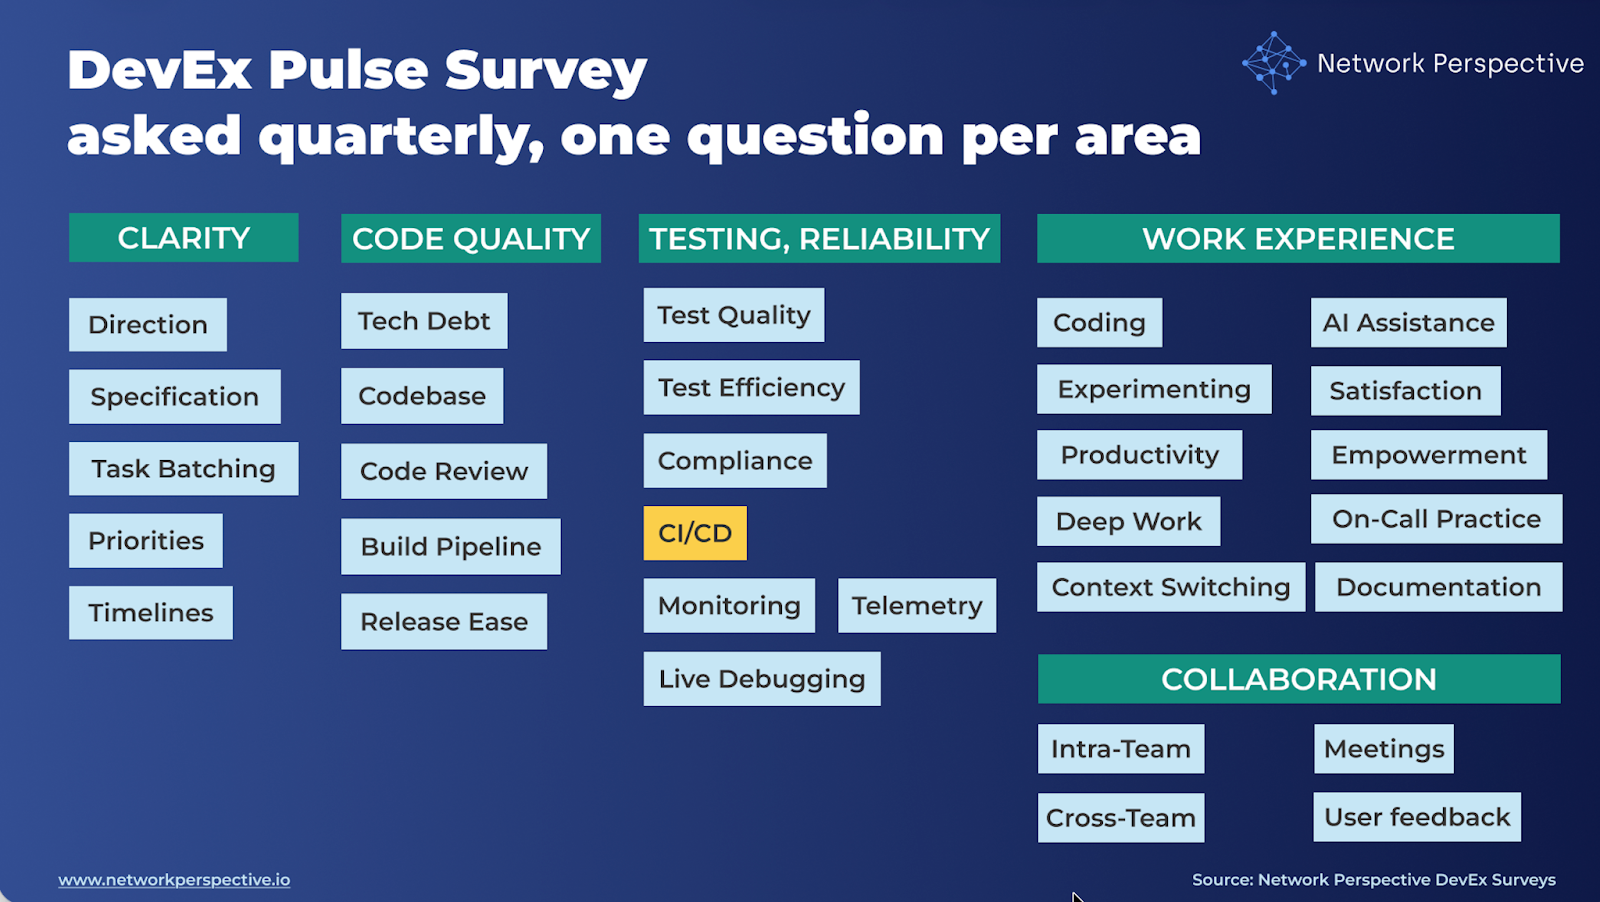
In our DevEx AI tool, we use two sets of survey questions: DevEx Pulse (one question per area to track overall delivery performance) and DevEx Deep Dive (a focused root-cause diagnostic when something needs attention).

DevEx Pulse tells us where friction is. DevEx Deep Dive tells us why it exists.

Let’s take a closer look at CI/CD. If the Pulse question “Our CI/CD tools are fast and reliable” receives low scores and developers’ comments reveal significant friction and blockers, what should you do next? 

Here are 13 deep dive questions you can ask your developers to uncover the causes of friction in CI/CD, along with guidance on how to interpret the results, common patterns engineering teams encounter, and practical first steps for improvement. This will help you pinpoint what’s causing the problem and fix it on your own, or move faster with our DevEx AI tool and expert guidance.

CI/CD — DevEx Survey Questions for Engineering Teams

The real question is: Does CI/CD help changes move forward smoothly — or does it slow work down with waiting, failures, and reruns?

Deep dive questions should help you map how code review flows through your delivery process and identify where it breaks down:

Speed → Feedback → Stability → Failure Clarity → Recovery → Ownership → Cost

Here’s how the DevEx AI tool helps uncover this.

Speed

Does CI/CD finish quickly?

  1. Fast / CI/CD runs usually finish fast enough to keep work moving.
  2. ETA / It’s usually clear how long a CI/CD run will take.

Blocking

Does CI/CD block work?

  1. Not blocking / Work doesn’t often stop while waiting for CI/CD to finish.
  2. Early / CI/CD failures usually show up early, not at the very end.

Reliability

Does CI/CD fail for real reasons?

  1. Stable / CI/CD usually passes when the code is correct.
  2. Not flaky / CI/CD doesn’t fail randomly or for unclear reasons.

Failures

Are failures easy to handle?

  1. Clear fail / When CI/CD fails, it’s clear what went wrong.
  2. Clear fix / It’s usually clear what needs to be fixed when CI/CD fails.

Recovery

Can CI/CD be fixed quickly?

  1. Quick recover / CI/CD problems are usually fixed quickly.
  2. No reruns / CI/CD rarely needs to be rerun just to get a clean result.

Care

Is CI/CD looked after?

  1. Owned / It’s clear who owns and maintains CI/CD.
  2. Improved / CI/CD is improved over time, not just fixed when broken.

Effort

  1. Weekly / Thinking about waiting for CI/CD runs, rerunning pipelines, investigating failures, or fixing CI/CD problems — about how much time is spent in a typical week dealing with this?
  • None
  • Less than 1 hour
  • 1–2 hours
  • 3–5 hours
  • 6–10 hours
  • More than 10 hours

Open-ended question (for comments)

Ideas to spot or reduce friction?

How to Analyze DevEx Survey Results on CI/CD?  

Does CI/CD help changes move forward smoothly — or does it slow work down with waiting, failures, and reruns? Here’s how the DevEx AI tool helps make sense of the results.

How to Read Each Section

Speed

Questions

  • Fast – CI/CD runs usually finish fast enough to keep work moving
  • ETA – It’s usually clear how long a CI/CD run will take

What this section tests

Whether CI/CD is fast and predictable, or slow and hard to plan around.

How to read scores

  • Fast ↓, ETA ↓
    → CI/CD is slow and unpredictable.
  • Fast ↑, ETA ↓
    → CI/CD can be fast, but timing is unclear.
  • Fast ↓, ETA ↑
    → CI/CD is known to be slow and planned around.

Key insight

Slow or unpredictable CI/CD turns finished work into waiting time.

Open-ended comments – how to read responses

  • “Takes forever” → slow pipelines
  • “No idea when it finishes” → unclear timing
  • “Hard to plan around runs” → speed pain

Key insight

Waiting on CI/CD is one of the biggest hidden delivery costs.

Blocking

Questions

  • Not blocking – Work doesn’t often stop while waiting for CI/CD
  • Early – CI/CD failures usually show up early, not at the very end

What this section tests

Whether CI/CD blocks progress, or gives early feedback that allows work to continue.

How to read scores

  • Not blocking ↓, Early ↓
    → CI/CD blocks work and fails late.
  • Not blocking ↑, Early ↓
    → Work continues, but problems appear too late.
  • Not blocking ↓, Early ↑
    → Early failures help, but CI/CD still blocks progress.

Key insight

Late CI/CD failures waste more time than slow runs.

Open-ended comments – how to read responses

  • “Fails at the end” → late signal
  • “Blocked until pipeline finishes” → work stoppage
  • “Surprises after waiting” → timing problem

Key insight

Early feedback matters more than fast feedback.

Reliability

Questions

  • Stable – CI/CD usually passes when the code is correct
  • Not flaky – CI/CD doesn’t fail randomly or for unclear reasons

What this section tests

Whether CI/CD fails for real reasons, or creates noise.

How to read scores

  • Stable ↓, Not flaky ↓
    → CI/CD is noisy and unreliable.
  • Stable ↑, Not flaky ↓
    → Code is fine, but CI/CD fails randomly.
  • Stable ↓, Not flaky ↑
    → Failures are real, but happen often.

Key insight

Flaky CI/CD trains teams to ignore failures.

Open-ended comments – how to read responses

  • “Fails, then passes on rerun” → flakiness
  • “Green doesn’t mean safe” → lost trust
  • “Just rerun it” → normalized noise

Key insight

Unreliable CI/CD slows decisions and reduces confidence.

Failures

Questions

  • Clear fail – When CI/CD fails, it’s clear what went wrong
  • Clear fix – It’s usually clear what needs to be fixed

What this section tests

How easy it is to understand and fix CI/CD failures.

How to read scores

  • Clear fail ↓, Clear fix ↓
    → Failures cause long investigations.
  • Clear fail ↑, Clear fix ↓
    → Problems are known, but fixes aren’t clear.
  • Clear fail ↓, Clear fix ↑
    → Fixes exist, but failures are confusing.

Key insight

Hard-to-understand failures waste time and break flow.

Open-ended comments – how to read responses

  • “Logs don’t help” → unclear failure
  • “Trial and error” → missing signals
  • “Ask someone else” → knowledge bottleneck

Key insight

Clear failure messages are essential for fast recovery.

Recovery

Questions

  • Quick recover – CI/CD problems are usually fixed quickly
  • No reruns – CI/CD rarely needs to be rerun just to get a clean result

What this section tests

Whether CI/CD can be fixed quickly, or drags on.

How to read scores

  • Quick recover ↓, No reruns ↓
    → CI/CD problems linger and require retries.
  • Quick recover ↑, No reruns ↓
    → Fixes exist, but reruns are common.
  • Quick recover ↓, No reruns ↑
    → Reruns aren’t common, but fixes are slow.

Key insight

Slow recovery multiplies the cost of every CI/CD failure.

Open-ended comments – how to read responses

  • “Takes days to fix” → slow recovery
  • “Retry until green” → rerun culture
  • “Pipeline stuck broken” → lingering issues

Key insight

Fast recovery matters more than avoiding every failure.

Care

Questions

  • Owned – It’s clear who owns and maintains CI/CD
  • Improved – CI/CD is improved over time, not just fixed when broken

What this section tests

Whether CI/CD is actively cared for, or left to decay.

How to read scores

  • Owned ↓, Improved ↓
    → CI/CD is nobody’s job.
  • Owned ↑, Improved ↓
    → Someone owns it, but has no time.
  • Owned ↓, Improved ↑
    → Improvements happen, but responsibility is unclear.

Key insight

CI/CD only gets better when someone owns it.

Open-ended comments – how to read responses

  • “No one owns it” → neglect
  • “Known problems never fixed” → lack of priority
  • “Old pipeline kept alive” → decay

Key insight

Untended CI/CD always becomes slower and noisier.

Effort

Question

  • Weekly – Time spent waiting for CI/CD, rerunning pipelines, chasing failures, or fixing CI/CD issues

How to read responses

  • 0–1 hr/week → Healthy CI/CD flow
  • 1–3 hrs/week → Some friction
  • 3–5 hrs/week → Systemic drag
  • 6+ hrs/week → Must-fix CI/CD problem

Key insight

Time spent dealing with CI/CD pain is the clearest cost signal.

Pattern Reading (Across Sections)

Pattern  — “Slow Lane” (Very common)

Pattern:

Speed ↓ + Blocking ↓

Interpretation

CI/CD delays work more than it helps.

Pattern  — “Flaky Pipe” (Very common)

Pattern:

Reliability ↓ + Recovery ↓

Interpretation

Teams waste time chasing false failures.

Pattern  — “Late Pain” (Common)

Pattern:

Blocking ↓ + Failures ↓

Interpretation

Problems show up late and are hard to fix.

Pattern  — “Neglected CI/CD” (Medium)

Pattern:

Care ↓ + Effort ↑

Interpretation

CI/CD issues are known but not addressed.

How to Read Contradictions (This Is Where Insight Is)

Contradiction Fast ↑, Effort ↑

CI/CD runs quickly, but failures cause rework.

Contradiction Stable ↑, No reruns ↓

CI/CD passes, but only after retries.

Contradiction Clear fail ↑, Clear fix ↓

Problems are known, but fixing them is slow.

Contradiction Owned ↑, Improved ↓

Ownership exists without capacity.

Contradictions show where CI/CD looks fine on paper but hurts in practice.

Final Guidance — How to Present Results

What NOT to say

  • “CI/CD is broken”
  • “Developers rerun pipelines too much”
  • “People need to be more careful”

What TO say (use this framing)

“This shows where our CI/CD system slows work instead of speeding it up.”

“The issue isn’t people — it’s speed, clarity, and recovery.”

One Powerful Way to Present Results

Show three things only:

  1. How long CI/CD runs take
  2. How often CI/CD fails for no real reason
  3. How many hours per week CI/CD friction costs

Using DevEx CI/CD Insights to Improve How Teams Move Changes Through the Pipeline

Here’s how the DevEx AI tool will guide you toward making first actions. 

First Steps Per Section

Speed

Goal: Make CI/CD runs fast enough and predictable.

First steps

  • Identify the slowest pipeline stages and measure their duration.
  • Split long pipelines into parallel jobs where possible.
  • Add pipeline duration visibility (expected runtime shown in CI UI).
  • Run fast checks early (lint, build, unit tests).

Blocking

Goal: Reduce situations where work stops while CI/CD runs.

First steps

  • Move quick feedback checks earlier in the pipeline.
  • Allow local or pre-push checks for fast validation.
  • Use incremental builds or caching to reduce blocking time.
  • Separate fast validation pipelines from slower full pipelines.

Reliability

Goal: Ensure CI/CD failures represent real issues.

First steps

  • Track flaky tests and flaky jobs explicitly.
  • Introduce a flaky test quarantine or stabilization process.
  • Log and analyze pipeline reruns to identify common instability sources.
  • Stabilize infrastructure dependencies used in CI.

Failures

Goal: Make failures easy to understand and fix.

First steps

  • Improve error messages and logs in pipeline steps.
  • Highlight the failing stage clearly in CI output.
  • Add links to documentation or runbooks for common failures.
  • Standardize how failures are reported across pipelines.

Recovery

Goal: Reduce time spent fixing CI/CD problems.

First steps

  • Define who responds when pipelines break.
  • Allow rerunning only the failed stage instead of the full pipeline.
  • Add alerts when pipelines stay broken for long periods.
  • Maintain a simple CI/CD troubleshooting guide.

Care

Goal: Ensure CI/CD is actively maintained.

First steps

  • Assign clear CI/CD ownership (team or platform group).
  • Schedule regular pipeline improvement work (not only reactive fixes).
  • Track pipeline health metrics (duration, failure rate).
  • Encourage teams to propose CI/CD improvements.

Effort

Goal: Reduce weekly time lost to CI/CD friction.

First steps

  • Measure time-to-green for pipelines.
  • Identify common rerun reasons.
  • Track average pipeline duration and failure frequency.
  • Prioritize fixes for the highest-impact CI/CD pain points.

First Steps for Patterns

Pattern  — Slow Lane

Speed ↓ + Blocking ↓

First steps

  • Parallelize pipeline jobs.
  • Move fast checks earlier.
  • Reduce unnecessary pipeline stages.

Pattern — Flaky Pipe

Reliability ↓ + Recovery ↓

First steps

  • Track flaky tests and jobs.
  • Stabilize infrastructure dependencies.
  • Introduce a flaky test cleanup backlog.

Pattern — Late Pain

Blocking ↓ + Failures ↓

First steps

  • Move critical checks earlier.
  • Add incremental validation steps.
  • Fail pipelines as early as possible.

Pattern — Neglected CI/CD

Care ↓ + Effort ↑

First steps

  • Assign CI/CD ownership.
  • Schedule pipeline improvement work.
  • Track CI/CD health metrics regularly.

First Steps for Contradictions

Contradiction Fast ↑ + Effort ↑

CI/CD runs quickly, but failures cause rework.

First steps

  • Investigate common failure causes.
  • Improve failure messages and logs.
  • Stabilize flaky tests.

Contradiction Stable ↑ + No reruns ↓

Pipelines eventually pass but require retries.

First steps

  • Identify stages commonly rerun.
  • Stabilize test environments or dependencies.
  • Reduce nondeterministic tests.

Contradiction Clear fail ↑ + Clear fix ↓

Failures are visible but fixing them takes time.

First steps

  • Add runbooks for common failures.
  • Improve documentation of CI/CD stages.
  • Clarify ownership of failing components.

Contradiction Owned ↑ + Improved ↓

Ownership exists but improvements don’t happen.

First steps

  • Allocate dedicated time for CI/CD improvement.
  • Introduce CI/CD improvement backlog.
  • Track CI/CD metrics regularly.

The Core Improvement Rule

Optimize CI/CD for fast feedback and fast recovery, not just fast pipelines.

A CI/CD system that:

  • fails early,
  • explains failures clearly,
  • and is quick to fix

will support delivery far better than one that is only optimized for speed.

The Most Powerful First Step Overall

Move fast validation checks earlier in the pipeline.

For example:

  • lint
  • build
  • unit tests

When these checks run early:

  • failures appear sooner
  • waiting time decreases
  • reruns drop
  • developer feedback loops shorten

This single change usually improves:

  • speed
  • blocking
  • reliability
  • recovery
  • overall CI/CD effort.

There’s Much More to DevEx Than Metrics

What you’ve seen here is only a small part of what the DevEx AI platform can do to improve delivery speed, quality, and ease.

If your organization struggles with fragmented metrics, unclear signals across teams, or the frustrating feeling of seeing problems without knowing what to fix, DevEx AI may be exactly what you need. Many engineering organizations operate with disconnected dashboards, conflicting interpretations of performance, and weak feedback loops — which leads to effort spent in the wrong places while real bottlenecks remain untouched.

DevEx AI brings these scattered signals into one coherent view of delivery. It focuses on the inputs that shape performance — how teams work, where friction accumulates, and what slows or accelerates progress — and translates them into clear priorities for action. You gain comparable insights across teams and tech stacks, root-cause visibility grounded in real developer experience, and guidance on where improvement efforts will have the highest impact.

At its core, DevEx AI combines targeted developer surveys with behavioral data to expose hidden friction in the delivery process. AI transforms developers’ free-text comments — often a goldmine of operational truth — into structured insights: recurring problems, root causes, and concrete actions tailored to your environment. 

The platform detects patterns across teams, benchmarks results internally and against comparable organizations, and provides context-aware recommendations rather than generic best practices. 

Progress on these input factors is tracked over time, enabling teams to verify that changes in ways of working are actually taking hold, while leaders maintain visibility without micromanagement. Expert guidance supports interpretation, prioritization, and the translation of insights into measurable improvements.

To understand whether these changes truly improve delivery outcomes, DevEx AI also measures DORA metrics — Deployment Frequency, Lead Time for Changes, Change Failure Rate, and Mean Time to Recovery — derived directly from repository and delivery data. These output indicators show how software performs in production and whether improvements to developer experience translate into faster, safer releases. 

By combining input metrics (how work happens) with output metrics (what results are achieved), the platform creates a closed feedback loop that connects actions to outcomes, helping organizations learn what actually drives better delivery and where further improvement is needed.

Returning to our topic — CI/CD — you can explore proven practices grounded in hundreds of interviews our team has conducted with engineering leaders, or take a look at – The Devexperts Way.

March 17, 2026

Want to explore more?

See our tools in action

Developer Experience Surveys

Explore Freemium →

WorkSmart AI

Schedule a demo →
Thank you! Your submission has been received!
Oops! Something went wrong while submitting the form.