Track lead time, deployments, and reliability using DORA metrics.
DORA Metrics turn your engineering delivery data into clear signals of speed, stability, and flow.
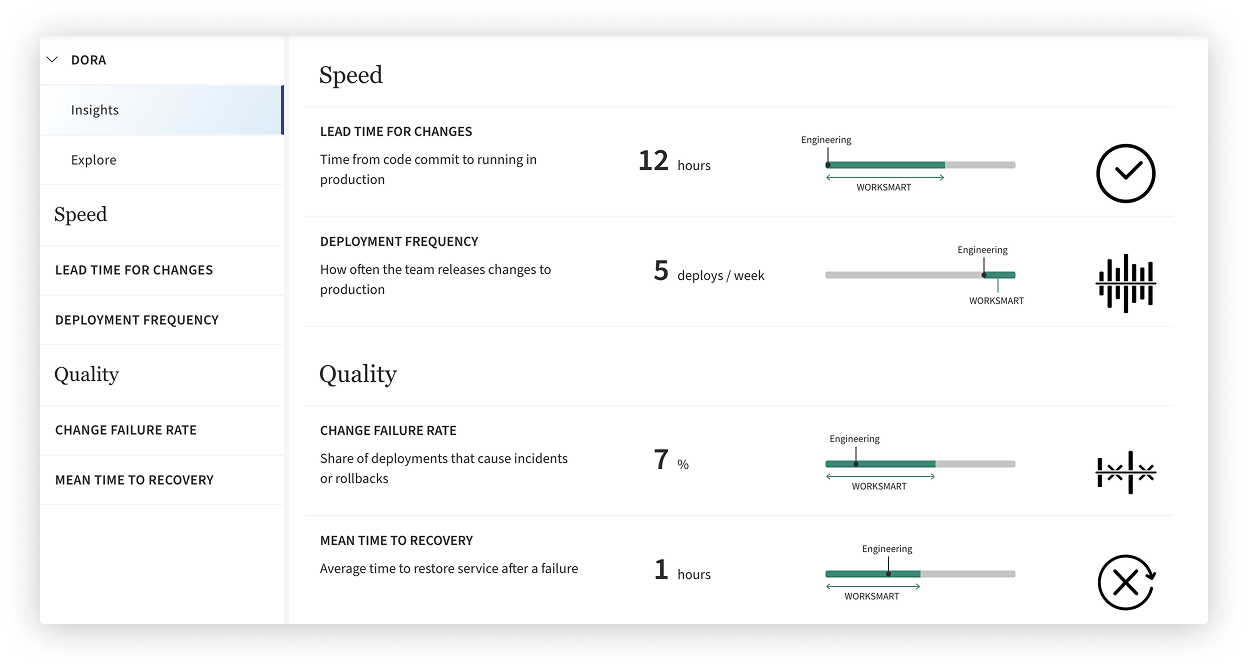
Track the four key indicators used by high-performing teams to understand how quickly code moves from commit to production
- and how reliably it runs once it’s there: deployment frequency, lead time, change failure rate, and time to restore.
Your delivery pipeline leaves signals everywhere—how long changes take to reach production, how often releases fail, how quickly systems recover. DORA metrics turn these signals into a clear view of how your engineering system performs. Move beyond assumptions. See where flow slows, stability breaks, and improvements actually work.
Is our lead time increasing as our system grows? Are deployments happening frequently enough for fast feedback? Do failures in production happen too often? How long does it take us to restore service when something breaks?Which teams deliver faster—and what can others learn from them?
Engineering teams often rely on assumptions about how fast they ship. But without clear signals, it’s hard to see where the pipeline slows down or stability breaks.
DORA metrics turn deployment and reliability data into a simple, trusted view of delivery performance—so you can understand how work flows from commit to production.
Gut feeling doesn’t reveal delivery bottlenecks. Commit counts don’t show how quickly changes reach production. And release chaos rarely appears in sprint reports.
DORA metrics cut through that noise.
They reveal the real signals behind engineering delivery.
DORA metrics help engineering leaders move from opinions to evidence. By tracking lead time, deployment frequency, change failure rate, and recovery time, teams can see whether improvements in tooling, testing, or collaboration actually make delivery faster and more reliable.
Instead of debating where problems might be, you get clear signals about how your delivery system behaves:
With these signals in place, teams can focus on improving the system—not guessing where the problem is.
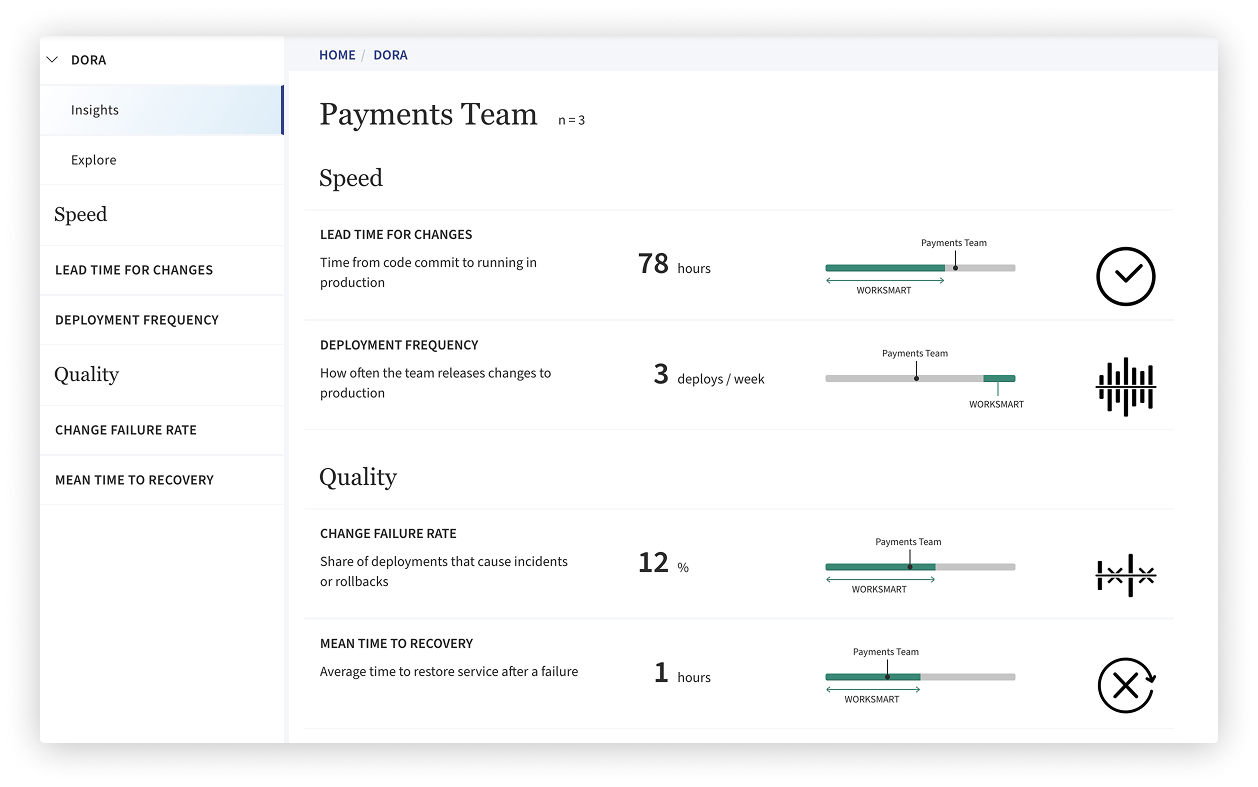
One team deploying faster might be an outlier. Three teams slowing down at the same stage of the pipeline? That’s a systemic issue. DORA metrics roll up delivery signals across teams, services, and repositories—so you can see where engineering work flows smoothly and where it consistently stalls.

You’re already investing in tools, processes, and people. But without visibility into how your delivery pipeline performs, you’re flying blind. Our DORA metrics reveal where releases slow down, where failures occur, and how quickly systems recover—so you can improve speed, stability, and flow across your engineering organization. Start small. Scale across teams. See improvement over time.


I’ve been working in the Workplace Analytics field for more than 10 years. I’ve completed a Ph.D. in economics and psychology, applying ONA (Organizational Network Analysis) in organizational design.
I believe that advanced Workplace Analytics with strong ethics upfront can enable people leaders to make their teams productive and happy in a new hybrid workspace.Let’s meet on LinkedIn →

I’m a Passionate People and Organization Development and Future of Work Practitioner with over 15 years of experience in senior ad executive people management functions.
MY PURPOSE is to develop effective, data-informed, agile, remote smart organizations that help people grow and feel enabled and self-fulfilled with the contribution that they make to the company's success both as team members and as individuals.Let’s meet on LinkedIn →

I’m working experienced senior full-stack developer working with people and applying research to business. PhD on applied AI, MSc in Computer Science, and MA in Psychology.
What I like most in Network Perspective? We put a lot of conceptual and technological effort in applying ethics and protecting privacy while handling with big data which makes our work challenging and meaningful.Let’s meet on LinkedIn →

I have over 19 years of experience in consulting sales of products and services related to employee development, talent acquisition, learning and development, and transition management.
I'm dedicated to helping leaders manage the value of employee experience by implementing Network Perspective analytical software. I also coordinate various knowledge-sharing initiatives on how to implement workplace analytics in an ethical and impactful way.Let’s meet on LinkedIn →